Managing data is complicated. Grand Rounds started out with a monolithic Rails application built atop a single database. When the need for data insights resulted in teams creating fragmented data platforms, we knew we needed a more unified approach.
In this post, we’ll explore the progression of Grand Rounds’s fragmented data platform to our modern, unified data infrastructure built to handle ingestion of complex object models in Salesforce, event streams coming through Kafka, and microservices exporting data to S3. This distributed yet unified data platform enables analysts, engineers, and data scientists to easily and efficiently collaborate with each other, while abstracting away the complexity of managing data.
Challenges
Here’s a breakdown of the challenges that prompted us to create a unified data infrastructure.
- Data from common data sources were extracted through bespoke code managed by multiple teams.
- Multiple Airflow instances were orchestrating data transformations and data ingestion.
- Individual teams were managing execution engines, ranging from Redshift clusters, to EMR instances, to BigQuery.
- Wrangling data from various warehouses became unmanageable and untraceable often leading to different teams reporting different values for key metrics.
- Data was often unvalidated leading to quality issues with internal and external reporting.
- When pipelines broke, it was difficult to pinpoint who owned the pipeline, and therefore, who was responsible for fixing the workflow.
The illustrations below represent a typical workflow for data producers and architecture of our previous infrastructure.

Figure 1: SDLC of creating a new data pipeline

Figure 2: Architecture of previous infrastructure
Clearly, this was not the right way to work, nor was it sustainable. The excessive overhead required to manage infrastructure was taking a toll on engineers and analysts, and too much tribal knowledge was required to be functional.
Goals
As we recognized the growing problem of managing data with a fragmented infrastructure, we began envisioning a platform to better facilitate collaboration among data users. By creating this unified data platform, we hoped to make data easy to:
- Produce: Common pathways are paved and config-driven.
- Consume: All datasets have easily discoverable owners, schemas, lineage, and health status.
- Validate: Each dataset undergoes user-defined validation rules before being published.
- Monitor: Job failures, validation failures, and missed service level agreements (SLAs) are automatically surfaced to data owners and consumers.
- Analyze: Every single dataset can be queried and joined with any other dataset in a unified SQL execution environment.
- Access: Data in notebooks or spark jobs is similarly ubiquitous and easily accessible using common libraries.
Data users should be focused on using the right data artifacts, the logic to transform the data, and finally ownership/governance over the newly produced artifacts, leaving the platform to take care of orchestration, execution, and alerting the right users when expectations about the data are not met. Our distributed platform enables the workflow demonstrated below.
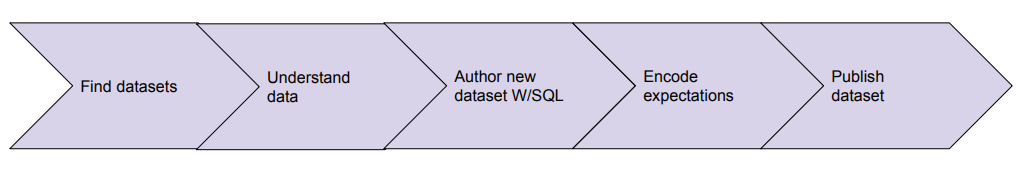
Figure 3: Ideal life cycle of a data pipeline
Buy vs. Build
We began by looking into vendors such as Snowflake or Databricks to act as the platform for analysts, data engineers, and data scientists. We discovered that no single vendor could solve all of our use cases. For example:
- Many vendors only satisfy a subset of the problems we were aiming to solve, which wouldn’t help us achieve the real value in our mission: to build a holistic system without compromise.
- Our use cases of diverse and complicated datasets with broad ownership across both analytics teams and data engineering require tailor-fitting solutions made for users with varying skill sets.
- Protecting our sensitive healthcare data is critical, and most vendors did not have a solution addressing the ability to mask or deny access at the table, column, or row level.
- Often, the hardest part of working with data is in the configuration of tasks, managing orchestration, and writing code to perform ingestions or transforms, and that’s something vendors often do not have a solution for.
Ultimately, we decided against outside vendors as data is and will continue to be a competitive advantage for data-driven companies like Grand Rounds.
This is not to say that we wanted to rebuild execution engines, orchestrators, or the offerings that Databricks and Snowflake provide. Rather, we needed a way to abstract away our usage of these systems so that we are agnostic to which tool we are using, and the platform will take care of the integrations with individual tools.
Definitions
Catalog
The catalog is a centralized repository responsible for storing metadata about all registered tables, which tasks produce them, and from where they originate.
Tasks
There are two basic task types that can be registered with the catalog: Ingestion and Projection.
Ingestion:
Ingestion tasks are responsible for reading data from external data sources, conforming the data according to the table schema to which the ingesting task will publish, writing data to the catalog, and registering the data with the catalog. An example of this is a CSV ingester which does the following steps before registering:
- Reads a CSV file from S3.
- Asserts that all fields defined in the table definition are in the ingested file.
- Validates the datatypes of each field.
- Makes minor data transformations, such as coercing dates into ISO timestamps.
- Registers the data with the catalog.
Projection:
Projection tasks are responsible for reading data from the catalog, applying transformations to that data, and writing the data back to the catalog under a new table. An example of this workflow is:
- An SQL query reads data from multiple tables in the catalog.
- Performs joins, transforms, and aggregations upon the data.
- Writes back the data into the catalog under a new table.
Table
A table is a versioned store of data. Each table has an owner, description, and set of schema versions. The schema is implemented as an annotated protobuf definition, containing all columns and metadata about each field. Example metadata includes comments and descriptions about each field and annotations on which fields need to be scrubbed or obfuscated if they contain sensitive information.
A diagram representing the relationships between task, table, and schema is shown below.

Figure 4: Relationship between task, table, and schema
Usage
Authoring
Authoring new datasets is as simple as users configuring a minimal set of fields to get their task executing properly. The set of fields are described below, as well as how the platform takes advantage of these fields to provide a streamlined experience.
- Task dependencies and task targets are used to automatically generate lineage graphs of tasks, so users no longer have to set CRON expressions to trigger tasks. When an upstream task runs to completion, the platform triggers its dependents. Internally, this is orchestrated by Airflow.
- Upgrades to the platform are seamless to users due to the abstraction provided by configuration as code. When the orchestration solution needed to be upgraded from Airflow 1.10 to Airflow 2.0 (which had schema breaking updates), users were able to get the benefit of this migration without any changes to existing code.
- Sensitive fields, such as a patient’s DOB, name, or address, are automatically scrubbed or hashed based on masking type, often corresponding to a de-identification rule defined under HIPAA regulations.
Monitoring
When tasks fail or do not update within an expected SLA, task owners are notified via Slack, email, or PagerDuty, depending on the owner’s configuration. Examples of task failures include bad logic, out of resource exceptions, or an assertion failing about data quality encoded, as Great Expectations tests, in validations.
Consumers of data are able to subscribe to individual tables, enabling them to receive updates when upstream tables fail.
Collaboration and Change Management
When deciding how users would interact with the catalog and where task and table definitions would be stored, two requirements had to be met: easy collaboration with other data users and access to version control of tasks and table definitions.
GitHub solves both of these problems, as defining tables and tasks in Git is a transparent way to store the current state of all cataloged tables, the history of changes to those tables, and a review process for modifying the catalog.
Workflow
To register a new data table, users open pull requests by updating table configuration files. Peers and domain owners are able to collaborate with the author of the pull request to validate assumptions, verify governance checks, and approve changes without interacting with any engineers.
Once a Pull Request(PR) is merged, the catalog service automatically detects changes in the repo, and newly created data tables are registered immediately.
Final Architecture
The diagram below shows our distributed yet unified data platform enabling analysts, engineers, and data scientists to easily and efficiently collaborate with each other. Data professionals interface with the data platform through Jupyter Notebooks, and an internal tool called DataHub built atop the popular open source tool by Pinterest, Querybook, which we will talk about in a future blog post. These tools provide a more user friendly interface to interacting with our platform than directly modifying config files described in this blog post.
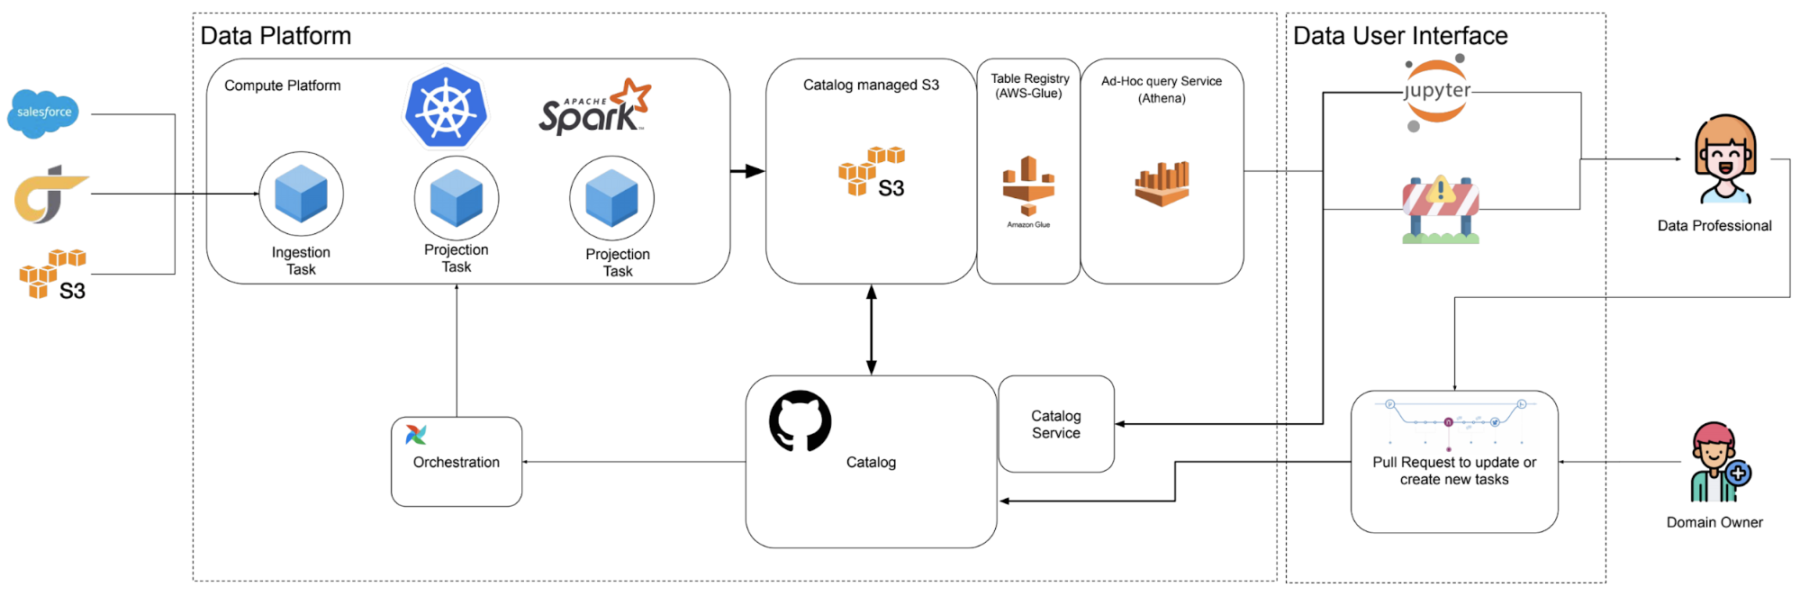
Figure 5: Simplified architecture of the data platform
Impact
Using this abstraction, we’ve enabled our small team of analysts to scale exponentially. Hundreds of data tables are being created or updated monthly, without our users needing to think about resource constraints, job scheduling, and understanding of the underlying infrastructure. All the while, our team of four platform engineers is able to deliver features that make our data users more empowered and reduce the friction of using data.
In the past quarter alone, our small team of four has rolled out features such as data validations, migrating to Airflow 2.0, asserting and alerting owners about data freshness/SLA of data, and migration from Athena 1.0 to 2.0. All of these features were deployed without impacting the user experience or making users migrate their existing configurations!
Future of the Platform
This is just the beginning of what we envision for the platform. Over the next year, we are exploring areas such as fields as first-class objects, one unified collaborative data model/mesh, reporting and presentation layers built to support our collaborative data model, and much more.
If any of the above sounds interesting, or if you are excited about working with engineers to build a data platform of the future, come work with us!
Acknowledgements
The data platform at Grand Rounds wouldn’t be where it is today without Matt Forbes and Brad Tofel, who built the original foundation, and the current team of engineers working on improving and stabilizing the system: Matt Forbes, Gabe Vacaliuc, Jake Bouricius, and Kartik Darapuneni.

Kartik Darapuneni is a Senior Software Engineer working on the Data Platform at Included Health. He enjoys building platforms that are scalable, easy to use, and most of all enable users to do more than they can today. You can learn more about Kartik on LinkedIn.